Wordle Analytics - Decoding the Daily Challenge
A wordle analytics dashboard and the process of creating an end-to-end data analytics project at zero cost.
Embark on a journey through data and analytics with me, where I explore the fascinating world of web scraping, analytics dashboards, and live website integration, all at zero cost. This adventure began with a simple yet wildly popular word game that took the internet by storm during the pandemic - Wordle.

Links to all the resources
- GitHub Repo
- Wordle - Kaggle Dataset
- Medium Article: A step by step working of this dashboard.
- Live Dashboard.
If you have any questions or inquiries, please feel free to contact me at sahilvora2024@gmail.com
So, what's Wordle?
It’s a daily word game that challenges players to guess a five-letter word within six attempts. Each guess is met with colored tiles offering feedback on letter matches and their correct positions. What sets Wordle apart is its accessibility; it’s not an app, requires no logins, and can be played just once a day. After each game, players can share their color-coded tile grids, withholding the day’s answer. You can stil play it here
This is how the tweets used to look like and the only data that was available publically during that time
I swear I almost threw my phone
— Marques Brownlee (@MKBHD) February 8, 2022
Wordle 234 5/6
⬛🟩🟩⬛🟩
⬛🟩🟩⬛🟩
⬛🟩🟩⬛🟩
⬛🟩🟩⬛🟩
🟩🟩🟩🟩🟩
Unveiling the Dashboard
As tweets flooded in from Wordle enthusiasts, I saw an opportunity to gain insights into everyone’s Wordle attempts. Which attempt led to success for most players? This curiosity ignited my journey into creating my very first analytics dashboard.
The Dashboard's Insights
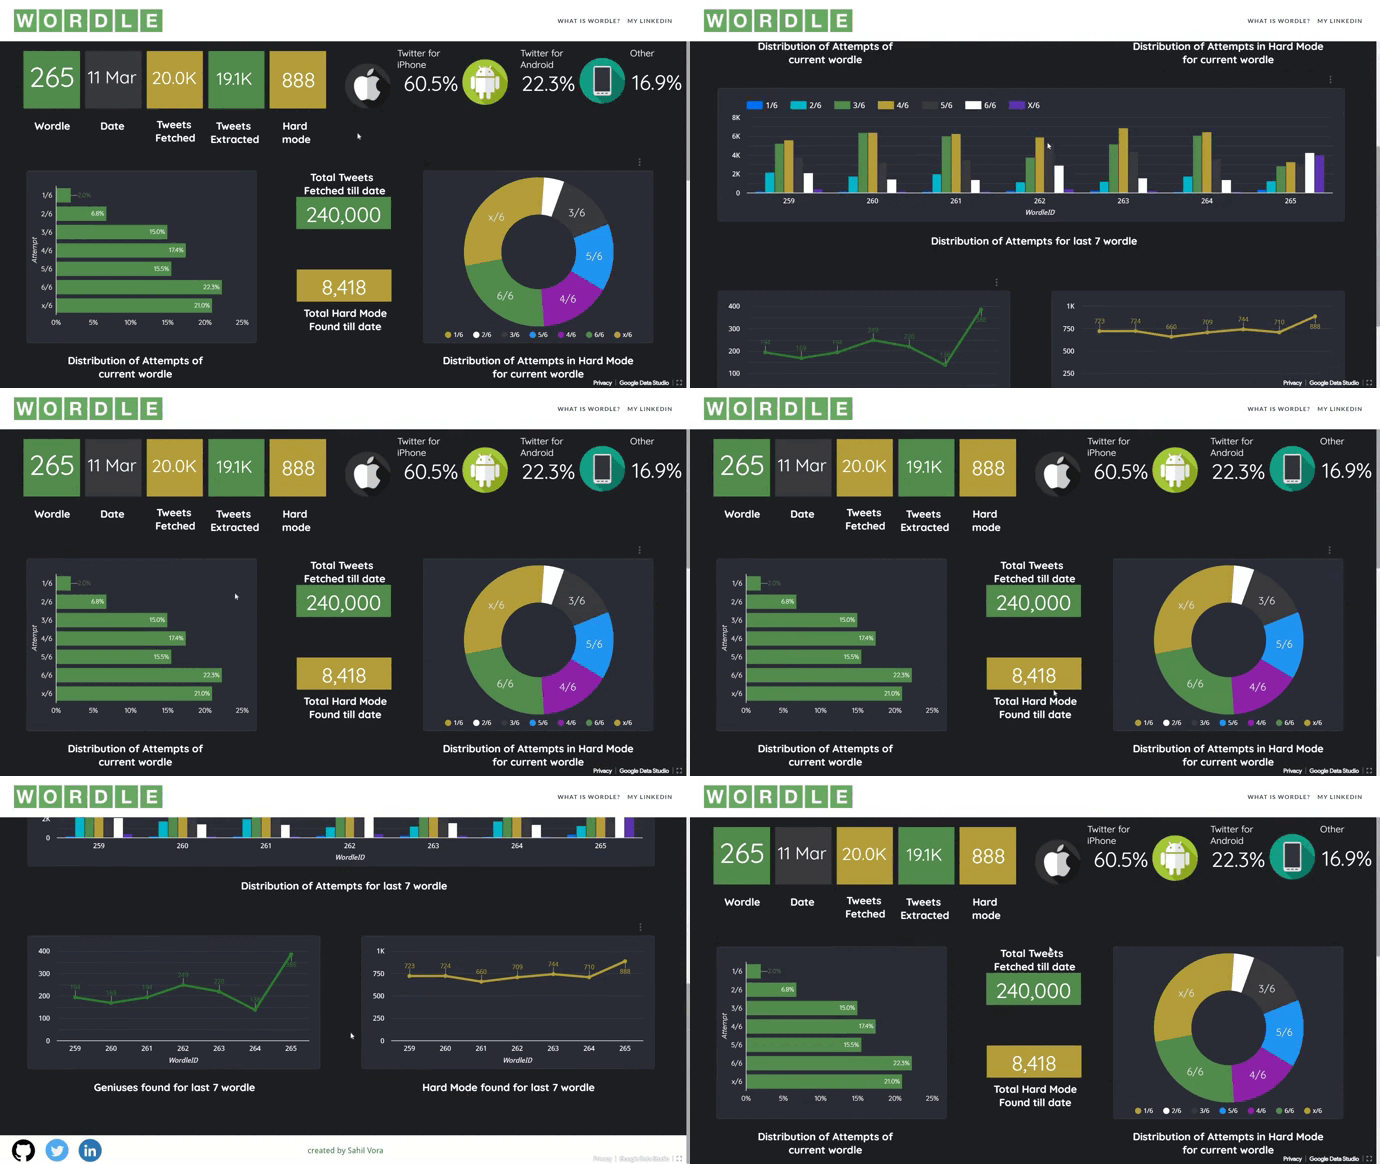
So, what does this dashboard reveal? It provides a daily snapshot of how Wordle enthusiasts worldwide tackled the game the previous day. Each day, the dashboard updates with data scraped from Twitter, collecting a sample dataset of 20,000 tweets. It showcases the distribution of players attempting the game in Hard Mode, where revealed hints must be used in the next guess. This data corresponds to the previous Wordle ID, focusing on the day’s gameplay. The dashboard also offers a cumulative overview of the past seven days and highlights players who cracked the Wordle on their first attempt. Furthermore, it tracks the preference for Hard Mode over the past week.

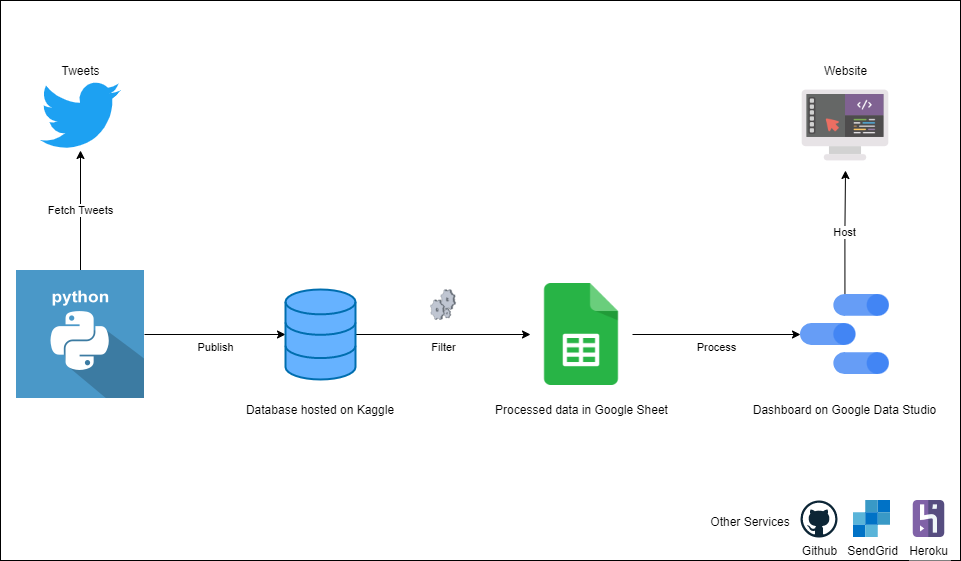
How was the Dashboard created?

A Journey of Firsts
This journey wasn’t just about creating a dashboard; it opened doors to several first-time experiences. I obtained my first Kaggle dataset, authored my maiden Medium article that has step-by-step procedure on how this dashboard was created, and crafted a live dashboard viewed by many. It even indirectly influenced the game’s creators to release a leaderboard-like statistics feature shortly after I launched my project.